In fall 2024 a Nevada agricultural commodity model was updated to generate five-year projections for four of the largest production sectors in the state: alfalfa/hay, cow-calf, milk, and sheep. This model is managed at the Nevada Agricultural Experiment Station (NAES) with funding from the Food and Agricultural Policy Research Institute (FAPRI). A wide array of global, national, and state data from private and public sources available in August 2024 informs the model. The five-year projections reflect expectations, holding the current conditions and assumptions constant. In reality, economic and production environments will certainly change, but the model output provides baseline measures that can be useful in decision making.
Moving out of the high economic volatility of the last several years, model projections point toward expectations for steady projection paths below recent peaks for most model estimates. However, macroeconomic measures such as interest rates and price levels are not expected to return to the pre-2020 levels before pandemic-related effects disrupted global markets. Expectations differ across different types of Nevada ag production – expectations for cow-calf producers are much rosier than those for alfalfa/hay producers, for example. Of course, the outlook for agriculture generally, and each commodity specifically, is also a function of short-term uncertainties like weather, or medium-term factors such as the cattle cycle or realizing full production of an alfalfa stand.
A set of charts are provided here as a summary of the model projections in August 2024 (vertical black bars separate historic recorded data from model projections). References for model input data and researcher contact information are provided at the end of the article if interested in more detail. The model will be updated in spring 2025 and a corresponding report will be available through the NAES website.
Macroeconomic Factors
Like all U.S. commerce, the Nevada agricultural economy is impacted by global, national, and regional economics, all subjected to much uncertainty and volatility over the last four years. At the risk of oversimplifying the recent economy, only a few of many macroeconomic factors will be discussed here.
U.S. GDP did not fall as far in 2020 as many countries or regions and recovery has been strong relative to other advanced economies. The U.S. three-year (2021-2023) average annual growth is 3.4% compared to 3.3% for other advanced economies. Along with the relative strength of U.S. GDP, the U.S. dollar has been much stronger to other global currencies than prior to 2020. This can be beneficial for importing goods with stronger buying power but can discourage exports of goods that are effectively more expensive to many trading partners.
The Nevada economy could be considered upstart or emerging as compared to the U.S. and as such reflects much stronger growth of 5.1% over the same period. Nevada agriculture has faced greater adversity given lingering pandemic effects on the meat supply chain and severe multi-year drought through 2022. These challenges are reflected in a three-year average GDP of -15.8% (or 2.0% if netting out the extreme contraction in 2022 of -51.5%).
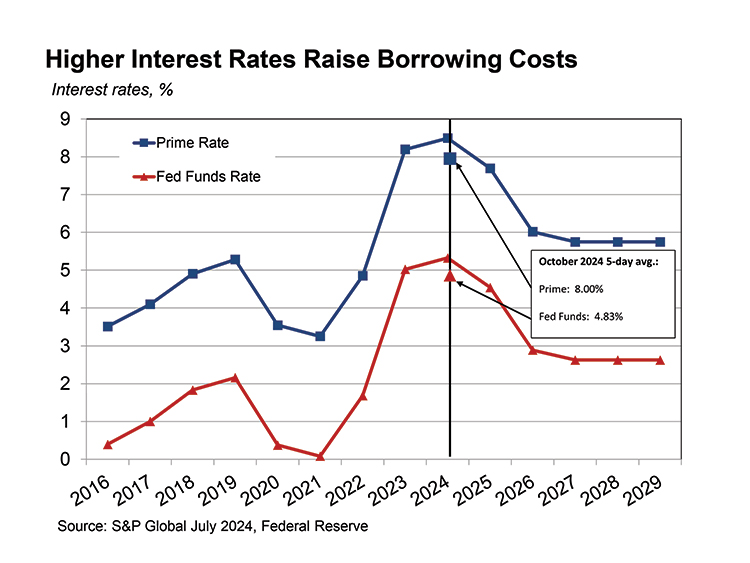
Though GDP growth rates and exchange rates are important to economic framework, these factors may be experienced more indirectly to both producers and consumers than interest rates, inflation rates, and price levels. The charts below reflect downward movement of interest rates, even since the recent model estimations, and are expected to average about 1% higher than 2019 levels. Softening interest rates is in part a reaction to falling inflation rates which have already returned to about 2.5%, nearing pre-pandemic levels.
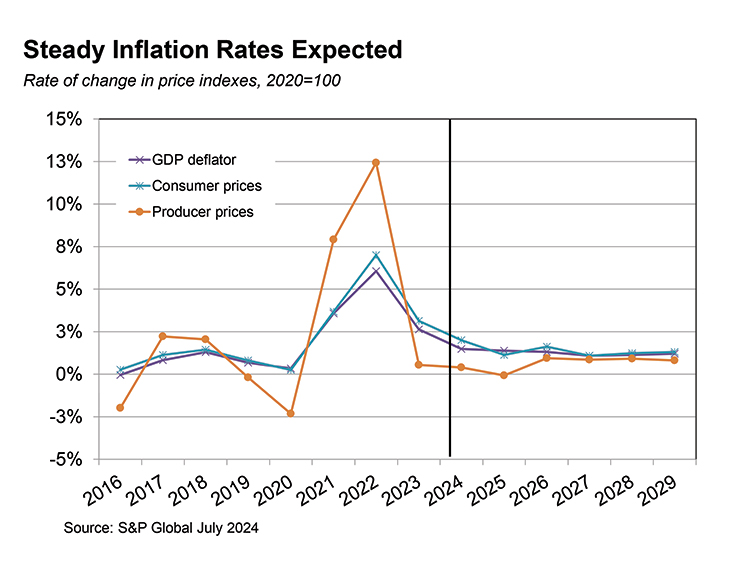
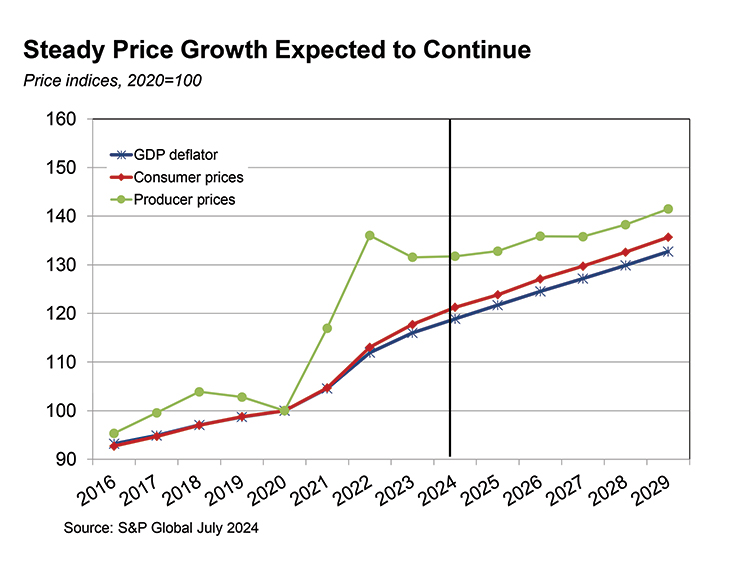
While inflation rates are well off recent peaks, price levels remain well above pre-2020 level. Price levels are expected to continue to grow at approximately 2.5% annually throughout the projection period. The price indexes shown here reflect a general basket of goods. In recent years, prices for important agricultural inputs such as feed, fertilizer, and fuel have been influenced by factors such as weather and global conflict and as such have been much more volatile than an average basket of goods might represent.
Alfalfa/hay
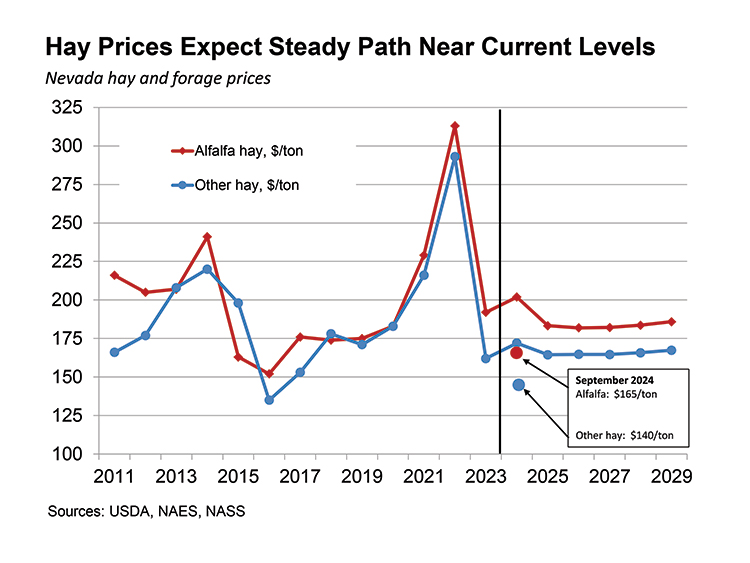
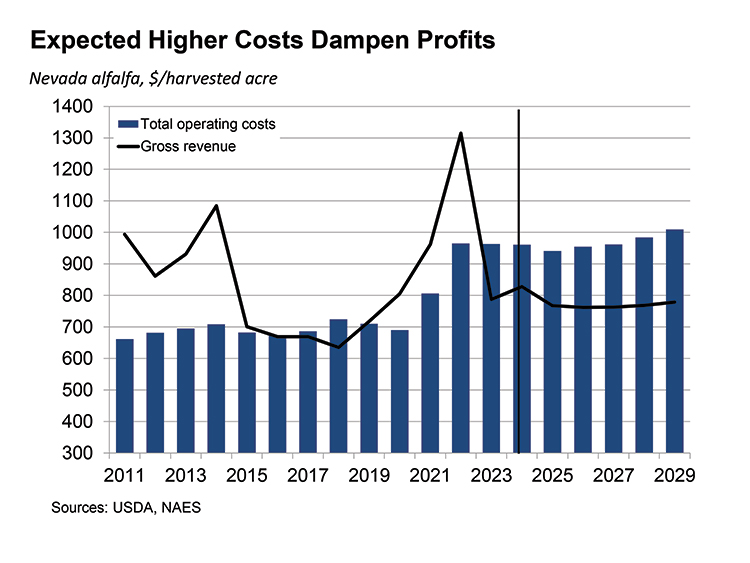
The current outlook for Nevada alfalfa/hay producers is most reflective of how current price levels squeeze profits. Combined with low cattle inventories (preview of cow-calf projections) and sufficient water in the last few years, both alfalfa and other hay September 2024 prices are well below the projection period respective averages of $187 and $167 per ton.
Gross revenue for alfalfa considers projected prices and is estimated on a per acre basis as are total operating costs. Gross revenue averages $778/per acre over the projection period as compared to $746 per acre average for the six-year period ending in 2019, a $32 per acre increase. The per acre total operating costs over the projected period are $969, reflecting current price level expectations discussed earlier. This paints poor expectations for all hay producers with a projection period average annual net revenue of -$191. Increase in demand with market expansion including growth in cattle inventories and high-test markets might help push per ton prices higher and minimize losses.
Cow-calf
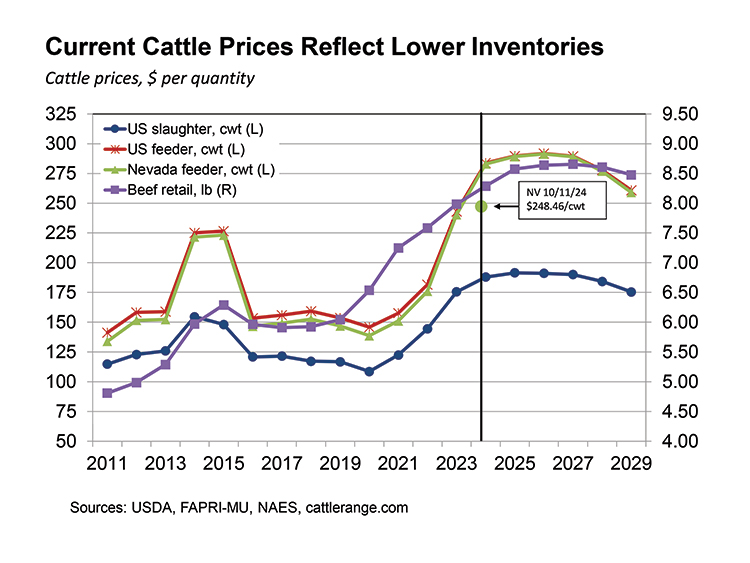
In contrast to alfalfa/hay producers, cow-calf producers expect to see a period of strong profitability similar to 2014 and 2015 throughout the projection period. Beginning in 2023 both U.S. and Nevada cattle price per hundredweight has been historically strong, approximately 25% higher than prior peak in 2014, and is expected to remain primarily due to relatively low cattle numbers. January beginning inventory for beef cattle in 2024 were about 6% lower than 2011 for the U.S. and about 1% lower over the same period for Nevada.
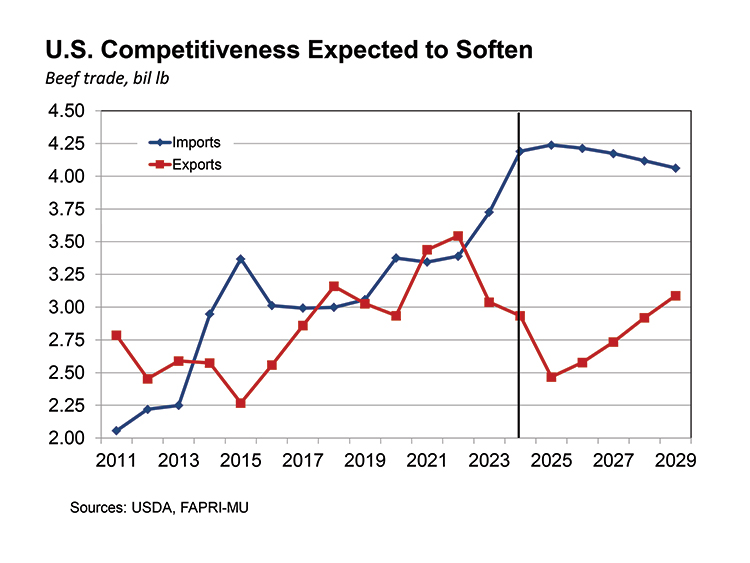
Though Nevada is not a large beef producer, beef prices are an important economic marker in the cattle supply chain. Average projection prices of beef per pound are about 43% higher than 2014, though 2023 represents the prior peak for beef prices reflecting inflationary effects. U.S. net exports generally increased through 2022 but have been trending downward given the relative strength of the U.S. dollar and soft GDP growth of many trading partners.
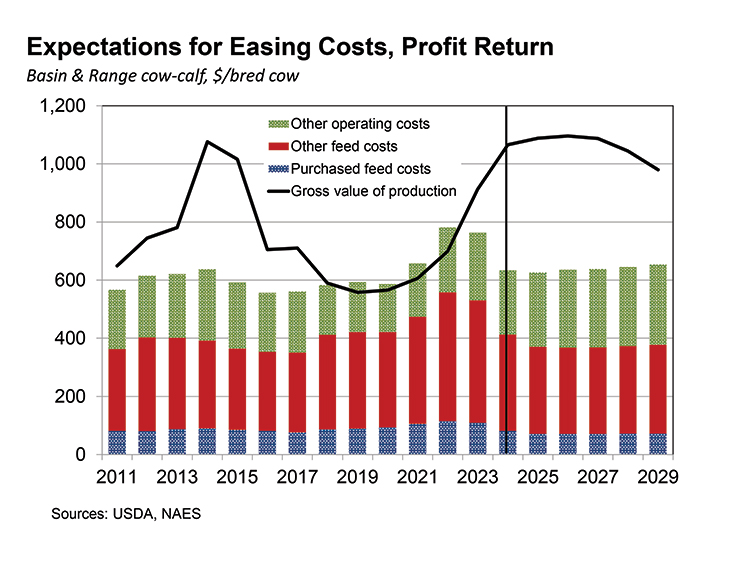
On a bred-per-cow basis, expected gross value of production for Basin & Range cow-calf pair averages $1,060 over the projection period compared to $776 for the six-year period ending in 2019, an increase in value of about 37%. The average for all costs across the projection period is $639, about a 9% increase compared to the six-year period ending in 2019, with non-feed related costs growing the most at 27% using the same comparison. The expected bumper profits for the projection period may be tempered as the cattle cycle moves back towards peak inventories, demand loss as beef prices rise, and weakened demand for U.S. beef exports.
Dairy
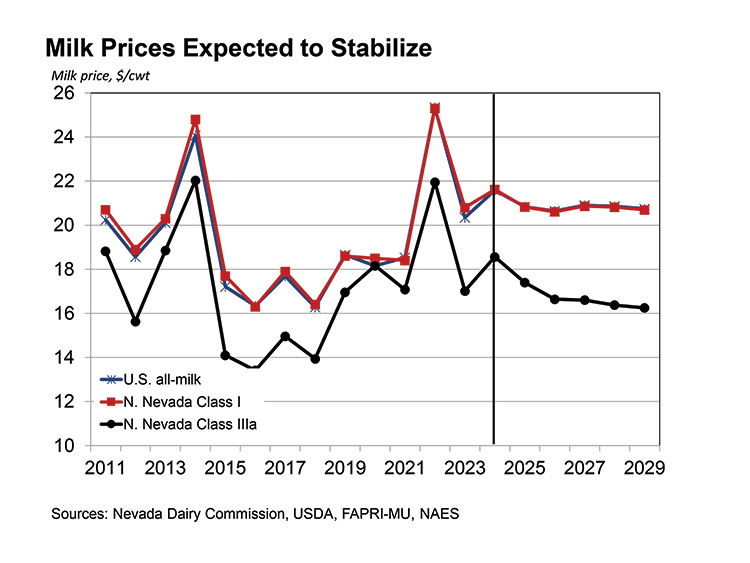
Nevada dairy producers expect to see stable prices and moderate profits throughout the projection period. Projection period prices for U.S. all-milk and Nevada class I average just under $21 per hundredweight, up about 13% compared to the six-year period ending in 2019. Nevada class IIIa prices average just under $17 per hundredweight, up about 7% compared to the six-year period ending in 2019. Both U.S. and Nevada dairy cow inventories are expected to remain relatively steady as they have for the past decade with very moderate gains in yield. Expected price growth is primarily driven by growing domestic and export demand.
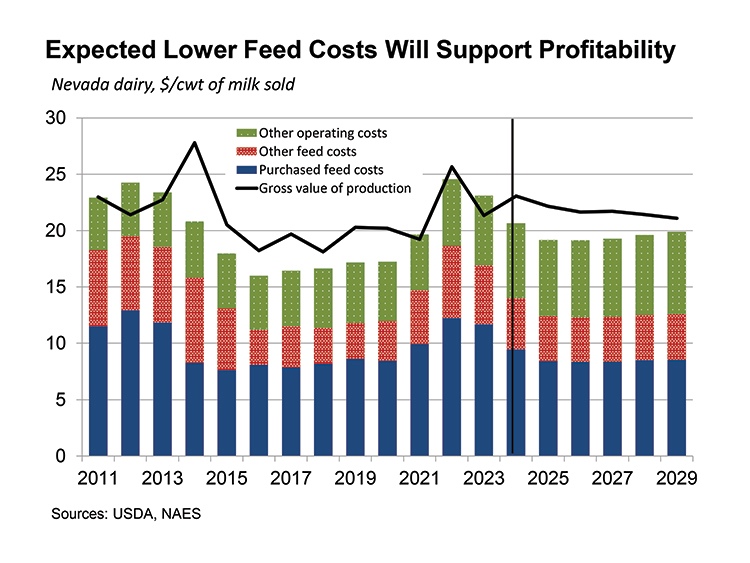
Expected gross value of production for Nevada sold milk averages $22 per hundredweight over the projection period compared to $21 for the six-year period ending in 2019, an increase in value of about 5%. The average for all costs across the projection period is $20, about a 12% increase compared to the six-year period ending in 2019, with the largest portion of costs attributed to purchased feed. Expected profits for the projection period average $2 per hundredweight, down about one-third from the six-year period ending in 2019, but still providing a cushion of profitability. For several decades, U.S. dairies have been trending towards greater concentration allowing producers to benefit from scale generating lower costs per unit. This also has provided a measure of stability for the sector when compared to other types of cattle operations.
Sheep
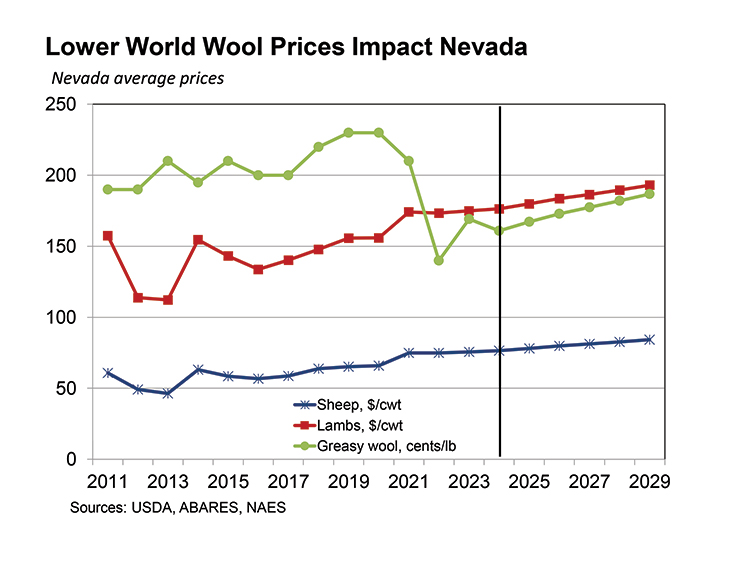
Nevada sheep producers expect to see stable prices and profits similar to historic averages through the projection period. Projection period prices for Nevada sheep average $81 per hundredweight, up about 32% compared to the six-year period ending in 2019. Projection period prices for Nevada lamb average $185 per hundredweight, up about 27% compared to the six-year period ending in 2019. Projection period prices for Nevada greasy wool average $1.75 per pound, down about 16% compared to the six-year period ending in 2019. Both U.S. and Nevada sheep inventories have declined significantly over the last several decades, with the decline relatively slowing since about 2016. Expected price growth for animals supported by low inventories, while wool prices continue to recover from pandemic era drop in demand.
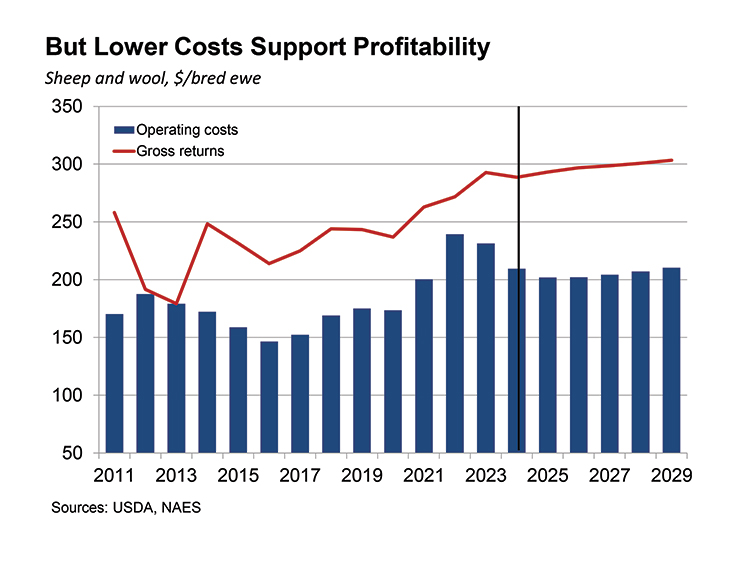
Expected gross returns for Nevada sheep averages $297 per bred ewe over the projection period compared to $234 for the six-year period ending in 2019, an increase in value of about 27%. Average operating costs across the projection period are $206, also about a 27% increase compared to the six-year period ending in 2019. Note that for the sheep sector, Nevada price data is available allowing for Nevada specific estimations, but only U.S. data is available for sheep operating costs and thus projections reflect national rather than state level costs.
Byline: Malieka Bordigioni, Research Manager
Nevada Agricultural Experiment Station
College of Agriculture, Biotechnology, and Natural Resources
University of Nevada, Reno
maliekal@unr.edu
References:
Board of Governors of the Federal Reserve System. Selected Interest Rates (Daily) – H.15. https://www.federalreserve.gov/releases/h15/, accessed 10/14/24.
Food and Agriculture Policy Research Institute. Baseline Update for Update for U.S. Agricultural Markets, August 29, 2024, https://fapri.missouri.edu/publications/2024-baseline-update/.
The Cattle Range. Feeder Steer Prices for the week ending 10/11/24, https://www.cattlerange.com/pages/market-reports/weekly-feeder-cattle-prices-by-state/, accessed 10/11/24.
U.S. Department of Agriculture, National Agricultural Statistics Service. Nevada Hay Prices August 2024, https://www.nass.usda.gov/Statistics_by_State/Nevada/Publications/Crop_Releases/Nevada_Hay_Prices/, accessed 10/11/24.
U.S. Department of Agriculture, National Agricultural Statistics Service. Quick Stats, https://quickstats.nass.usda.gov/, accessed 9/15/24.
