 The following is a summary of the April 1, 2025 Nevada NRCS Water Supply Outlook Report. To subscribe for future reports visit: nrcs.usda.gov/nevada/snow-survey
Winter 2025 scores a win in terms of snowpack across much of Northern Nevada. For three years running data collected at NRCS SNOTEL and snow courses has been above median on April 1 in the Northern Great Basin across the state to the Humboldt, Owyhee, Snake, Clover Valley and Franklin basins (Figure 1).
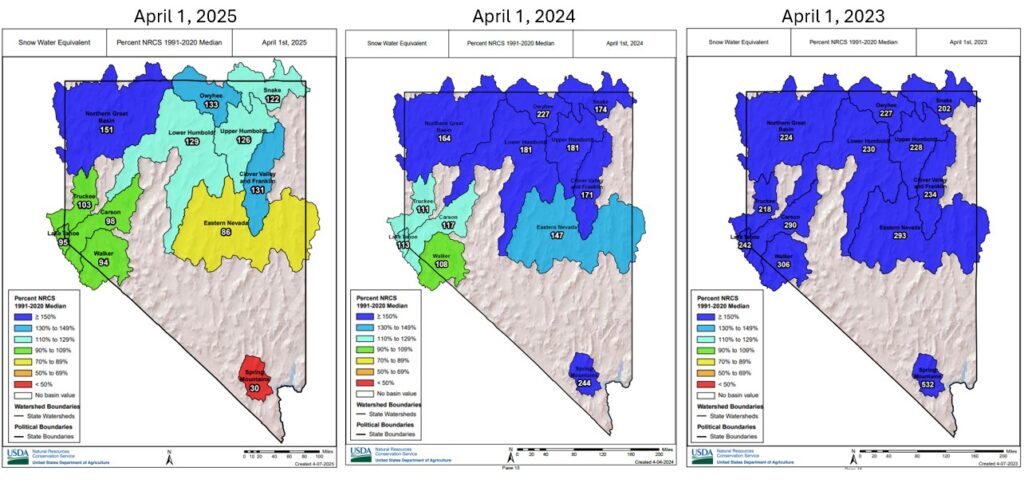
Figure 1: April 1 snowpacks for basins across Nevada in 2025, 2024 and 2023 indicate above median conditions three years running across northern Nevada. This year’s snowpack in the Eastern Sierra was close to normal. Eastern Nevada and the Spring Mountains came in less than normal in 2025.
The Lake Tahoe, Truckee, Carson and Walker basin snowpacks came in just below their normal peak snow water amounts in 2025 earning an honorable mention. The eastern Sierra and northern Nevada are in good shape as we move into snowmelt season. Eastern Nevada is a mixed bag with better mountain snowpack conditions near Austin, Eureka and Ely, but well below normal snow in Great Basin National Park. Southern Nevada should expect a lean water year with less than normal streamflow predicted for the Virgin River and the Colorado River inflow to Lake Powell.
April 1 snowpacks this year are 122-151% across northern Nevada, 94-103% in the Sierra basins, 86% in Eastern Nevada, 88% in the Upper Colorado, and 30% in the Spring Mountains. April 1 is typically when basin snowpacks reach their highest snow water total before melt begins. Of special note the Upper Humboldt Basin hasn’t had a three-year period with better consecutive snowpacks in since the early to mid-1980s (Figure 2).
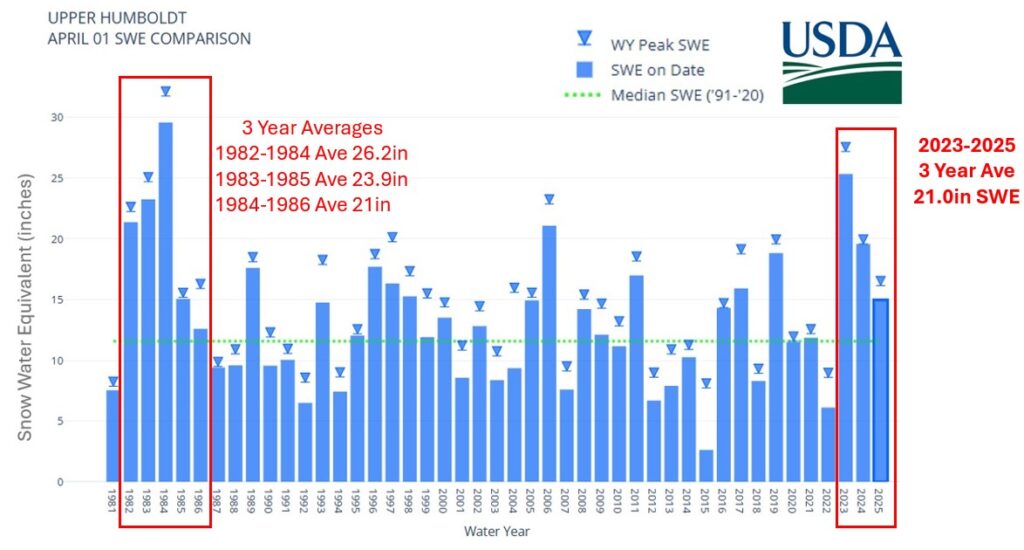
Figure 2: Between 2023-2025 the Upper Humboldt Basin peak snow water amounts (triangles) averaged 21.0 inches over three years. This is the highest three-year peak snow water average since the winters between 1982 and 1986.
After a slow start to the winter, above normal March precipitation produced a significant comeback for Eastern Nevada where basin snow percentages increased from 55% on March 1 to 86% by April 1. It should be noted that snow percentages in Eastern Nevada varied widely from site to site ranging from twice normal to less than 50%. In southern Nevada, the three SNOTELs in Spring Mountains were snow free on April 1, however Kyle Canyon and Lee Canyon #2 snow courses still had snow to measure. The April 1 snowpack in the Spring Mountains is 30% of median. The Colorado Basin has a decent snowpack in the north but abysmal snow in the south. The Upper Colorado snowpack is 89% of median, while the Lower Colorado is just 48% of median.
The majority of this year’s winter storms have been on the warmer side with snowlines higher on the mountains. Valleys have seen mostly rain and snowpacks below ~7,000 feet elevation have lagged behind normal. The low elevation snowpack in the Humboldt Basin was very different this year compared to last year. Taylor Canyon SNOTEL, at 6,320 feet, is the lowest elevation monitoring station in the basin. This year Taylor Canyon peaked with 1.6 inches of snow water in mid-February and melted-out by mid-March. Last year it was still near its peak amount on April 1 with 7.1 inches of snow water (Figure 3).
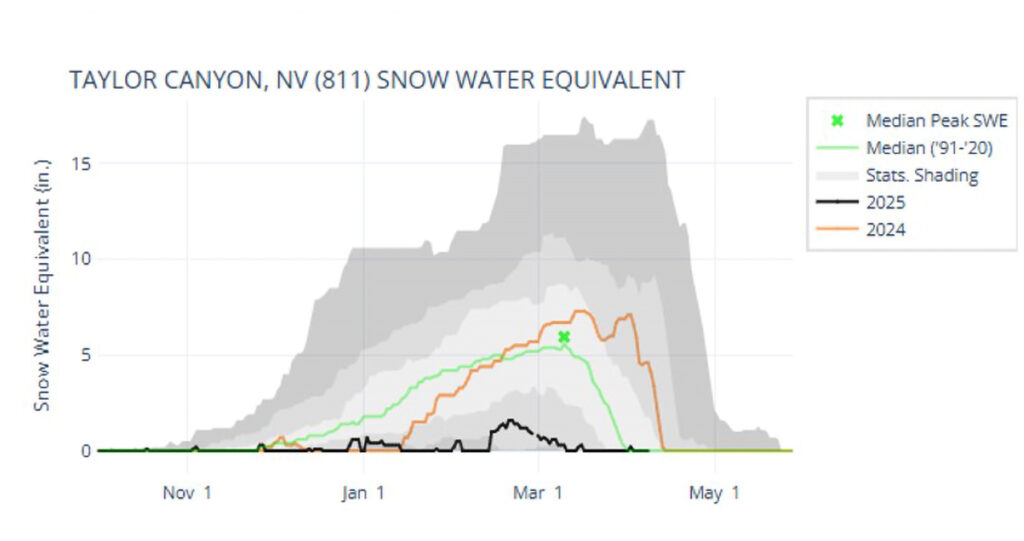
Figure 3: This graph shows snow water data at Taylor Canyon SNOTEL. This is the lowest elevation SNOTEL in the Upper Humboldt Basin at 6,320 feet elevation. Taylor Canyon’s 2025 snow water amounts were below median all winter and far less than in 2024. Conditions at Taylor Canyon SNOTEL are representative of other parts of the state which also saw below normal snow at lower elevations.
Water year precipitation (Figure 4, below) stands at 96-131% across the Sierra basins and northern Nevada. Statewide February and March were the strongest months of for precipitation this water year (Figure 5). Monthly precipitation was 96-229% of median in March and the areas that needed precipitation the most did the best with Eastern Nevada seeing 182% of median and the Spring Mountains at 229%. After a wet March, SNOTELs in Eastern Nevada are now 103% of normal for water year precipitation, however the Spring Mountains remain below normal at 84%. The Upper Colorado basin did well in March receiving 124% of median precipitation in March, bringing water year precipitation to 95%.
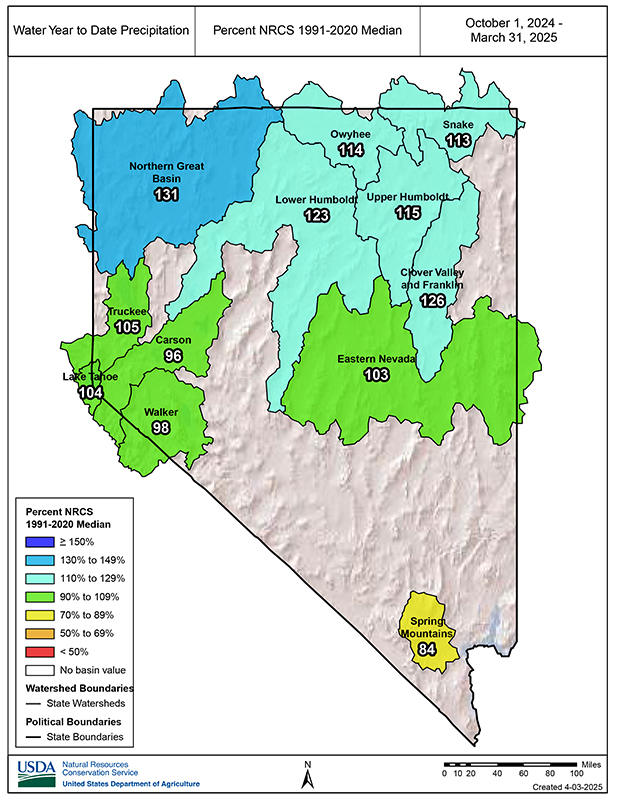
Figure 4: Water year precipitation October 1 through March 31, 2025.
STREAMFLOW FORECASTS
April 1 streamflow forecasts are above median in northern Nevada, close to median in the eastern Sierra and below median for the Virgin River (~69%) and Lake Powell Inflow on the Colorado River (74%). April 1 forecasts vary widely from 57-250% of median based on the 50% exceedance forecasts. This winter’s higher snowlines resulted in the geographic extent of snow-covered area being smaller. The impact of a smaller snow-covered area will impact this year’s April-July runoff compared to last year. At first glance April 1 snowpacks for 2024 and 2025 may appear similar with the Sierra near normal both years and Nevada above normal, but the disparity in snow-covered area may lead to a different timing and overall magnitude of streamflow this season. April-July streamflow volumes this season are expected to be less than last year due to the smaller extent of snow-covered area, and less snow at higher elevations.
Forecasts issues by the NRCS provide five exceedance levels which help quantify the spread in volumes that are possible depending on our future weather. The main snow accumulation months are now behind us. Precipitation during the April-July runoff period will play a big role in determining where observed flows land compared to the forecast exceedance range. Water supply decisions should be made by considering the full range of forecast volumes on both sides of the 50% exceedance forecast. Forecast skill increases through the water year. The spread in volumes between the five exceedances is much narrower now than it was in January. This is an indication of increased forecast skill and provides greater confidence for water managers to base their decisions upon.
RESERVOIRS
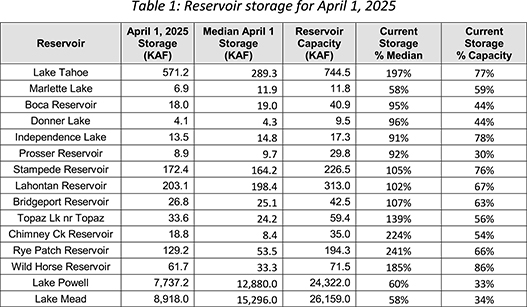
See chart below. Reservoir storage for northern Nevada is in good shape, most reservoirs are storing near normal to well above normal amounts for early April. Marlette Lake is being drawn down to allow major work on its dam this summer, trail closures will be in effect. Same is not true for reservoirs on the lower Colorado River where combined storage in Lake Powell and Lake Mead is down 691 kaf from this time last year.
DROUGHT STATUS
According to the US Drought Monitor released April 3, 2025, the northern-most counties in Nevada are free of drought. Above normal precipitation in March reduced drought severity in parts of Elko, Churchill, Lander and Eureka counties over the last month. Areas of extreme and exceptional drought in southern Nevada remain unchanged from last month.
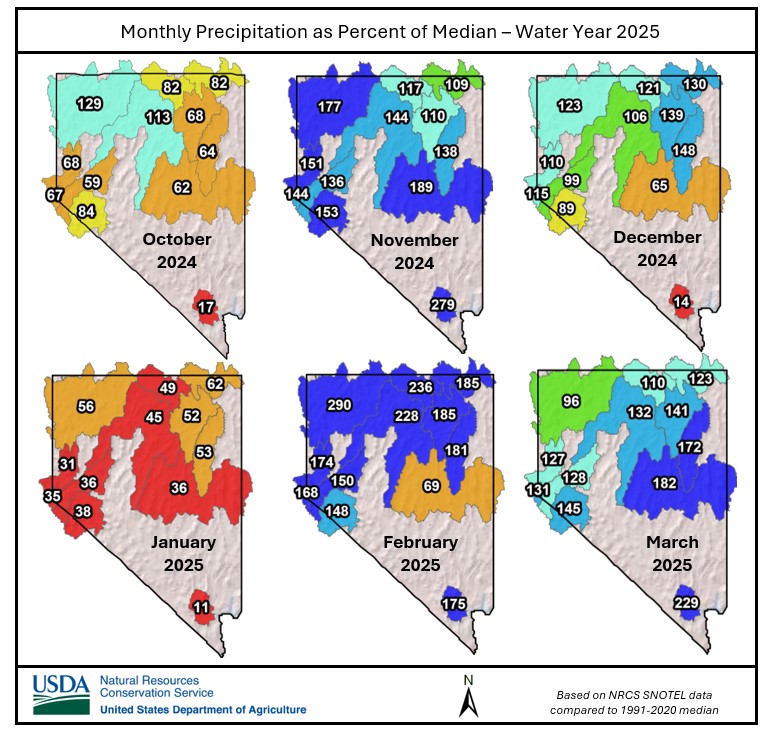
Figure 5: Monthly precipitation for water year 2025 varied month to month. January was the driest month while November, February and March brought above median amounts to most areas.
Visit the Drought Monitor here: droughtmonitor.unl.edu/CurrentMap/StateDroughtMonitor.aspx?NV
By Jeff Anderson, NRCS Snow Survey Water Supply Specialist