A grocery shopping overview provided by National Cattlemen’s Beef Association (NCBA)
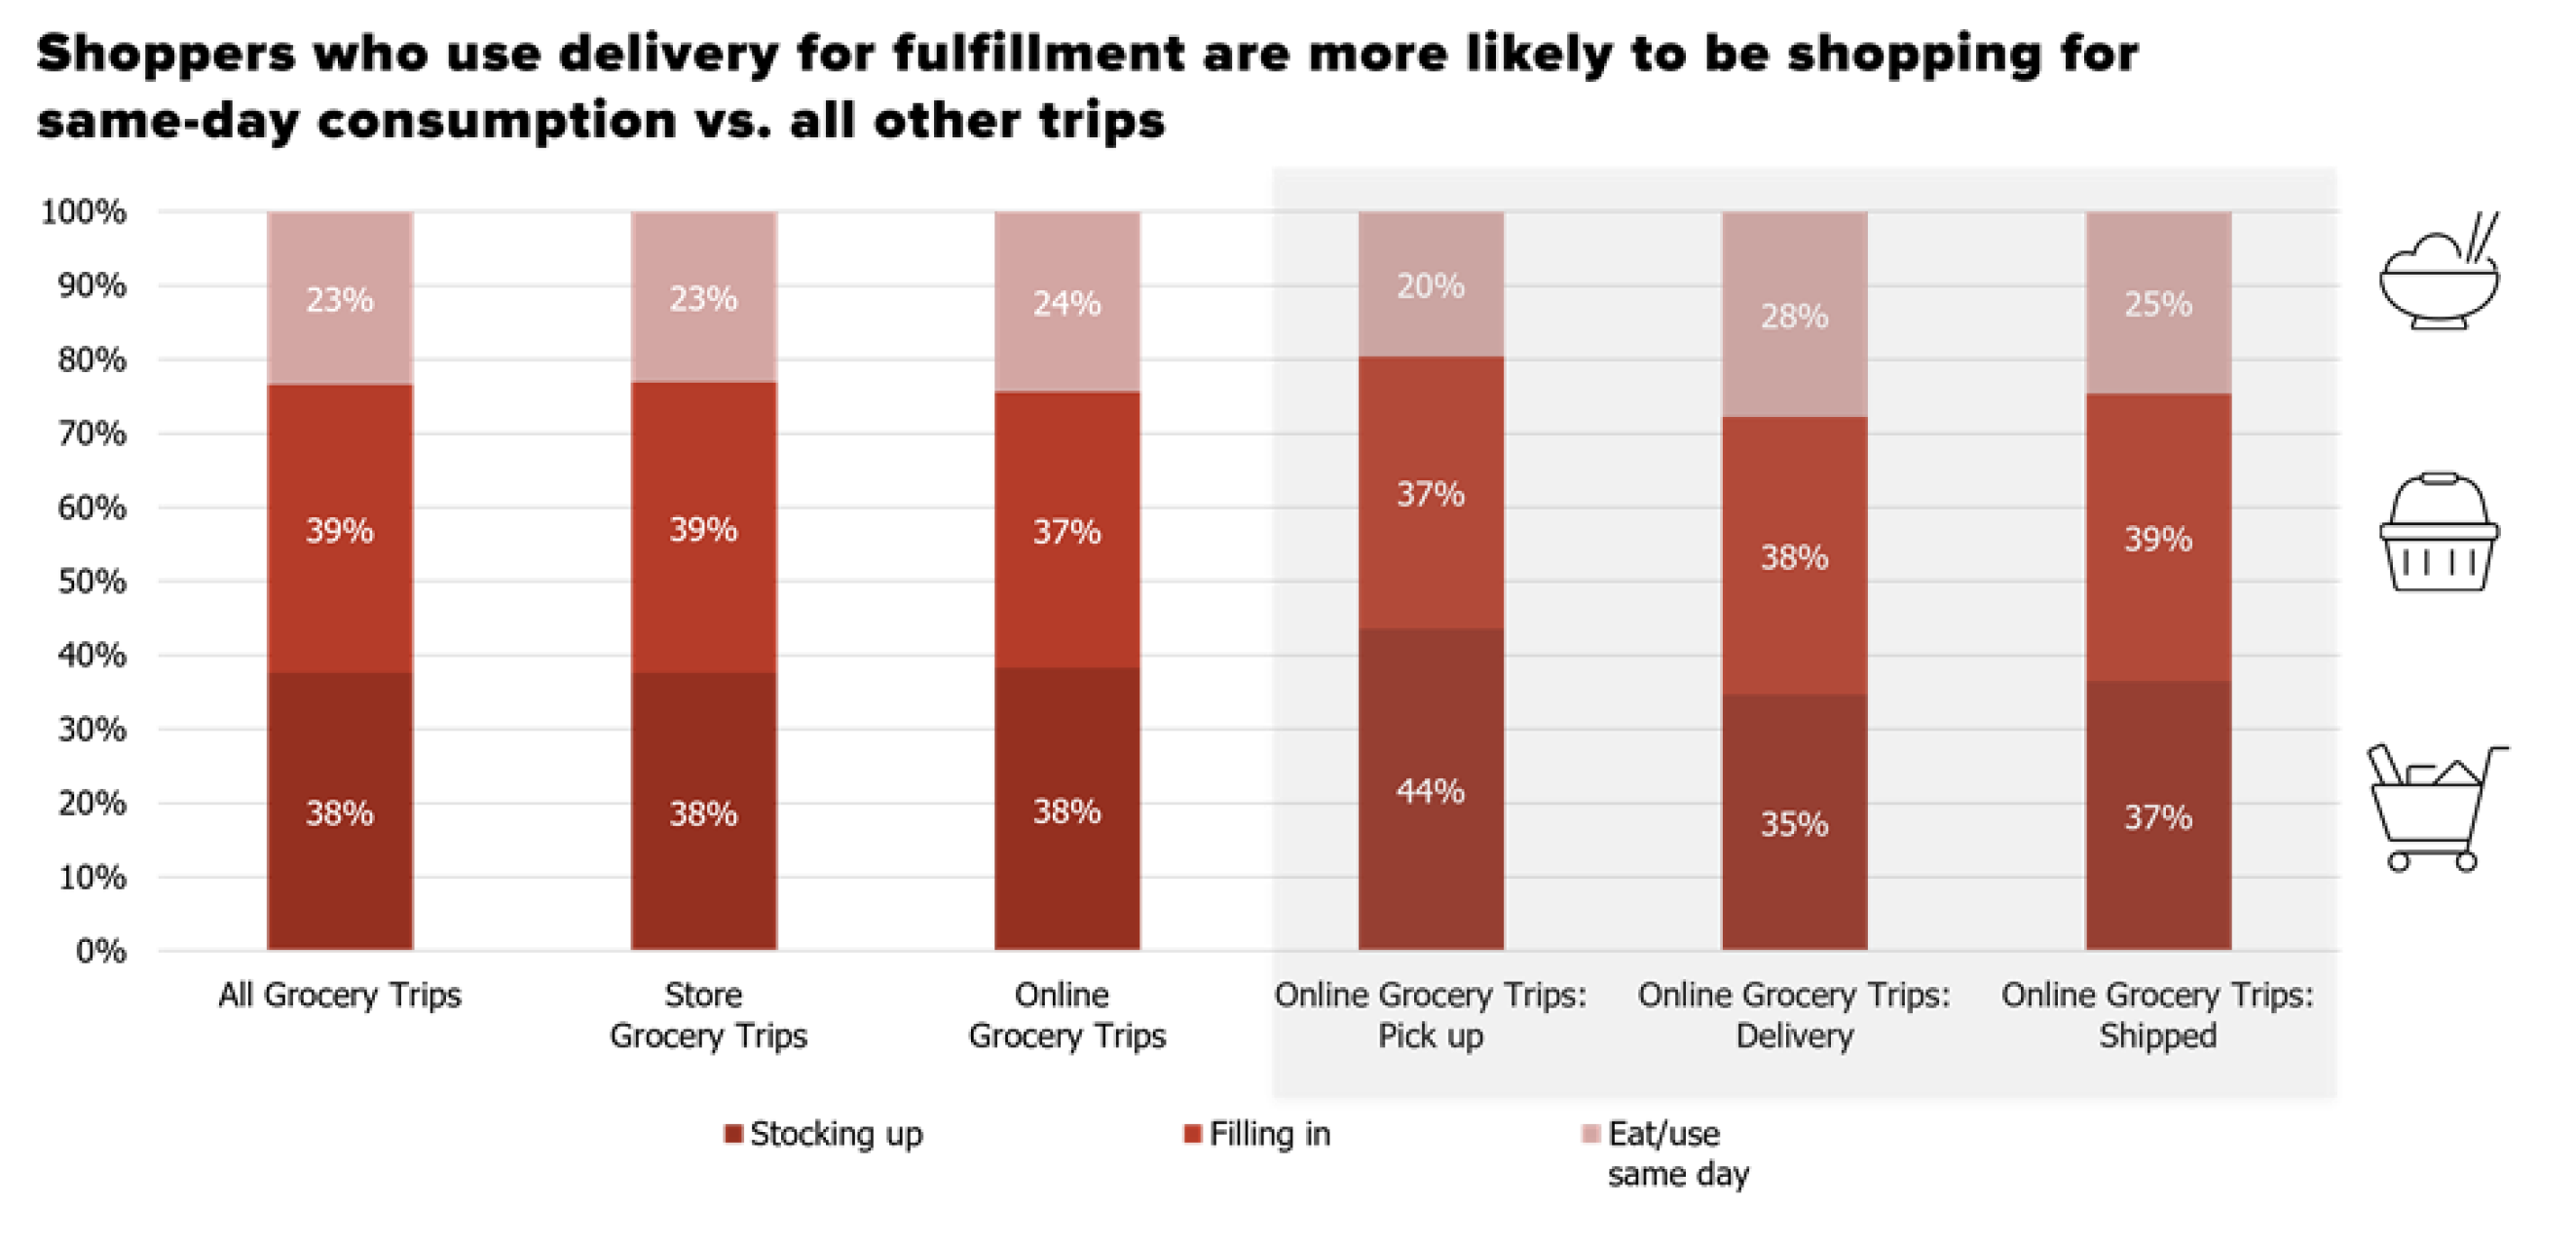
When asking consumers for reasons to head to the grocery store, a recent study released by Kagan Retail IQ, found nearly 40% of consumers are heading to the grocery store to stock up or fill-in for items needed to make meals at home, and nearly 25% are heading to the grocery store for same-day purchases, i.e., lunch, dinner, snacks, etc. Fig. 1
It’s worth noting a difference among those shopping online for pick-up at the grocery store and those having their groceries delivered. Online grocery store consumers having their groceries delivered are eight points more likely to shop for same-day use compared to those online consumers picking up at the grocery store.
This would suggest that targeting online grocery consumers picking up at the grocery store may be an effective way to increase bulk/larger inventory sales. Meanwhile, online grocery consumers who are having their purchases delivered may be receptive to meal ideas, snacks, or dessert items, as well as deli, ready-to-eat meals.
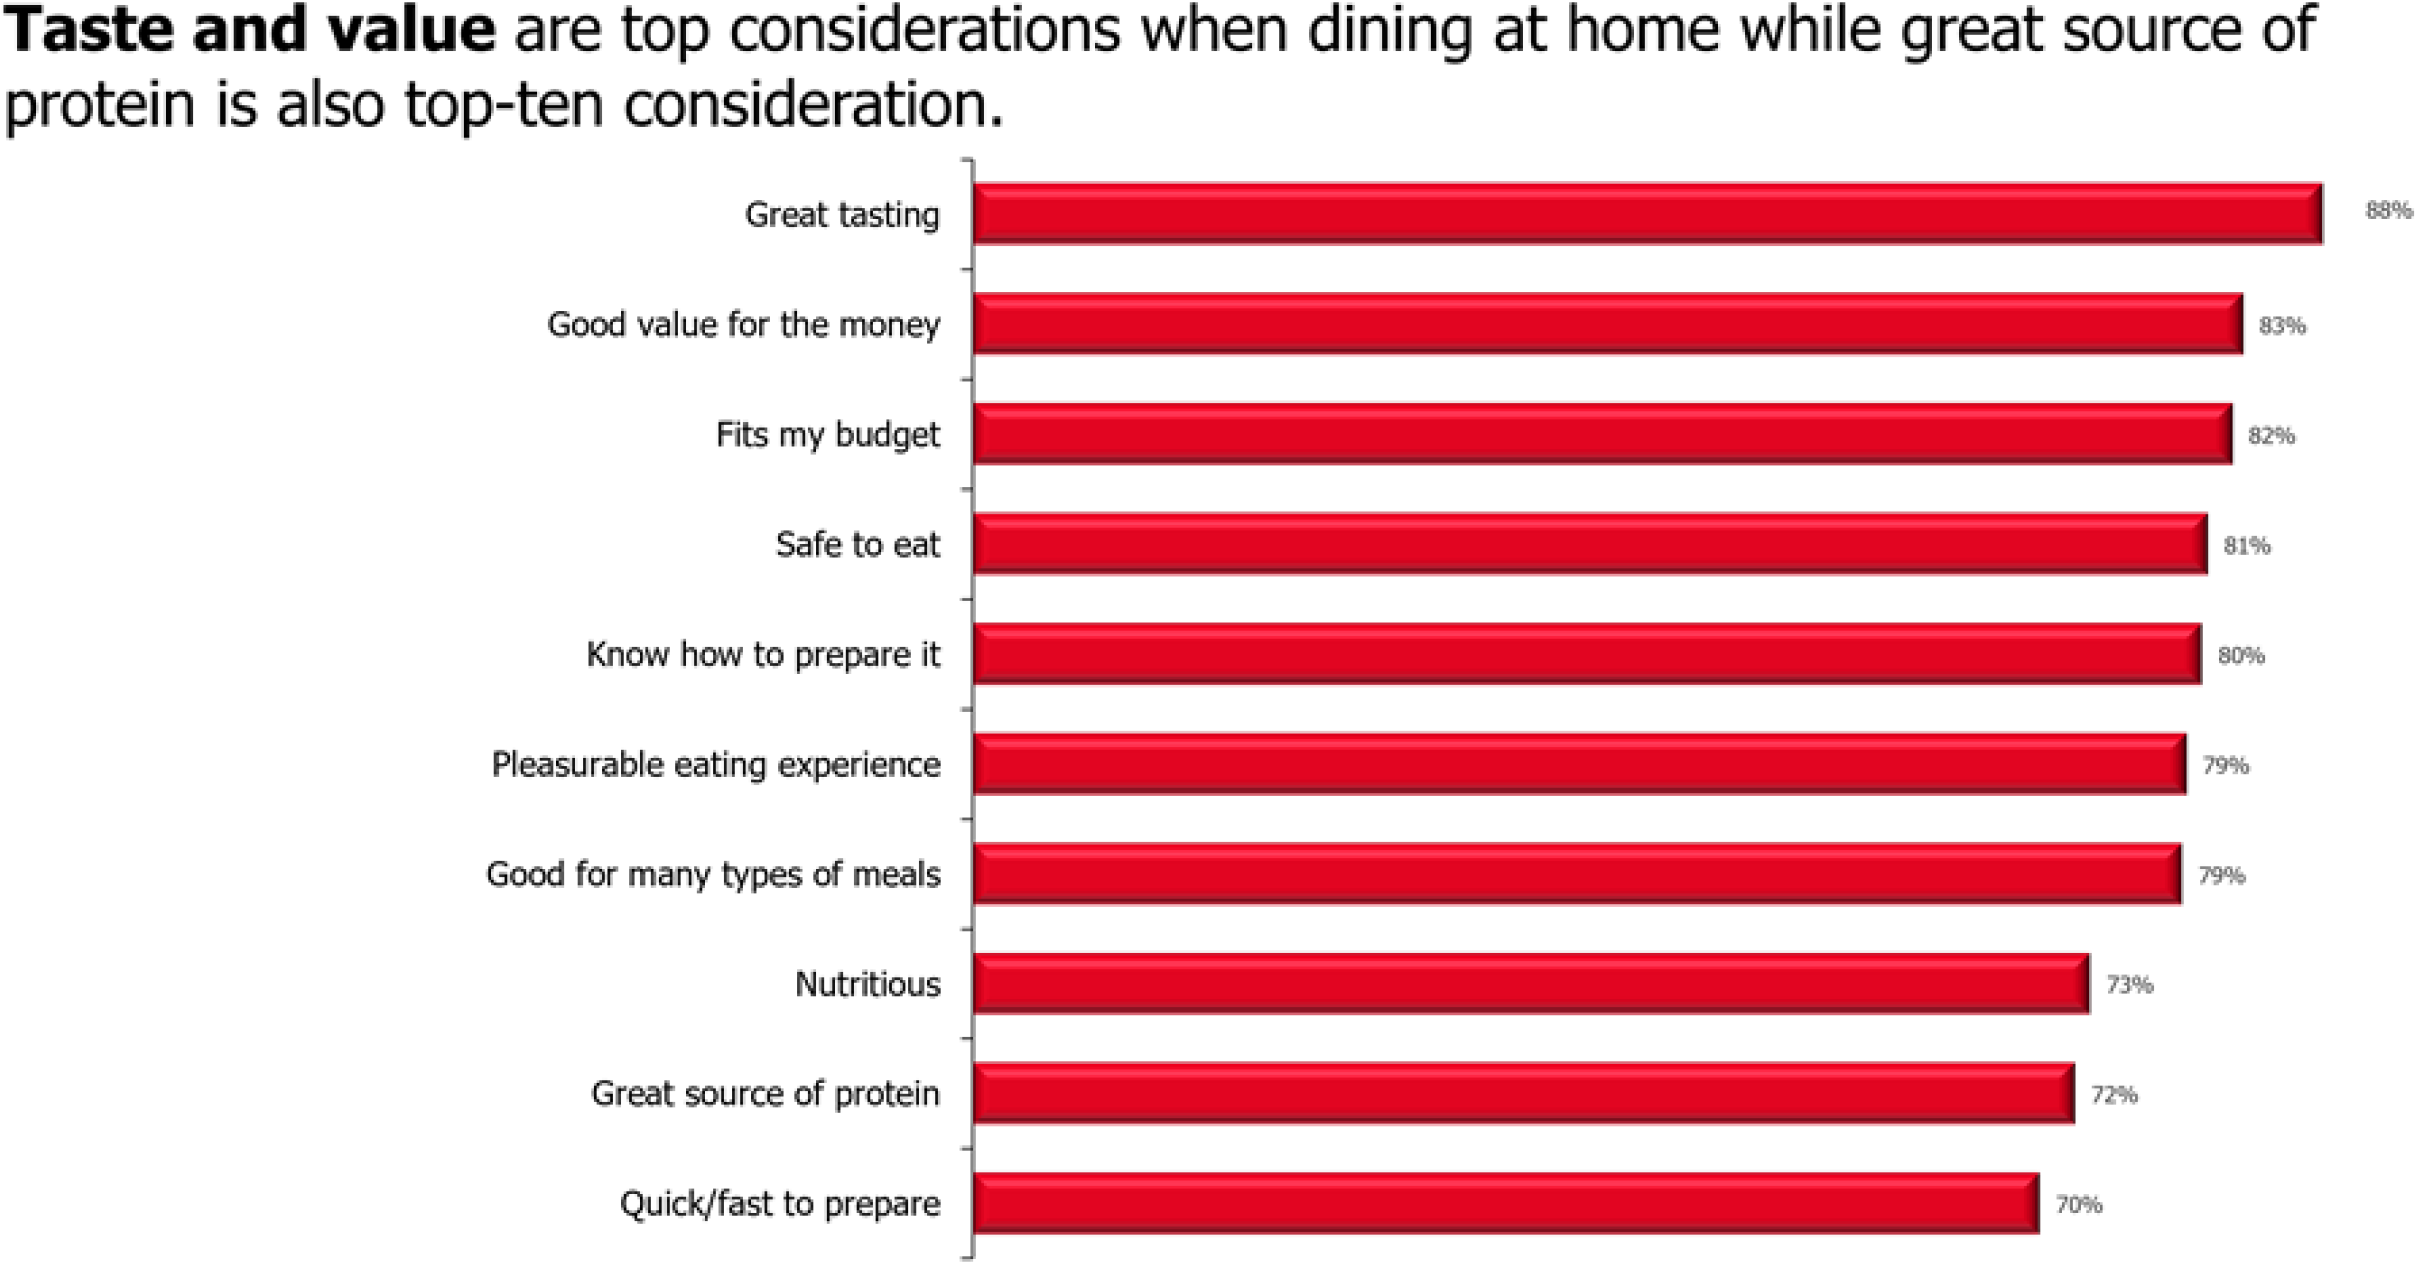
For those shoppers dining at home, an on-going nationally representative study, conducted by NCBA, a contractor to The Beef Checkoff, among consumers ages 18-64 found taste and value for the money remain a primary consideration for protein purchase considerations. Fig. 2 Other considerations include food safety, preparation familiarity, and great source of protein are also among the top-10 considerations for consumers when choosing protein for dining at home. Rounding out the top 10 considerations was quick/fast to prepare.
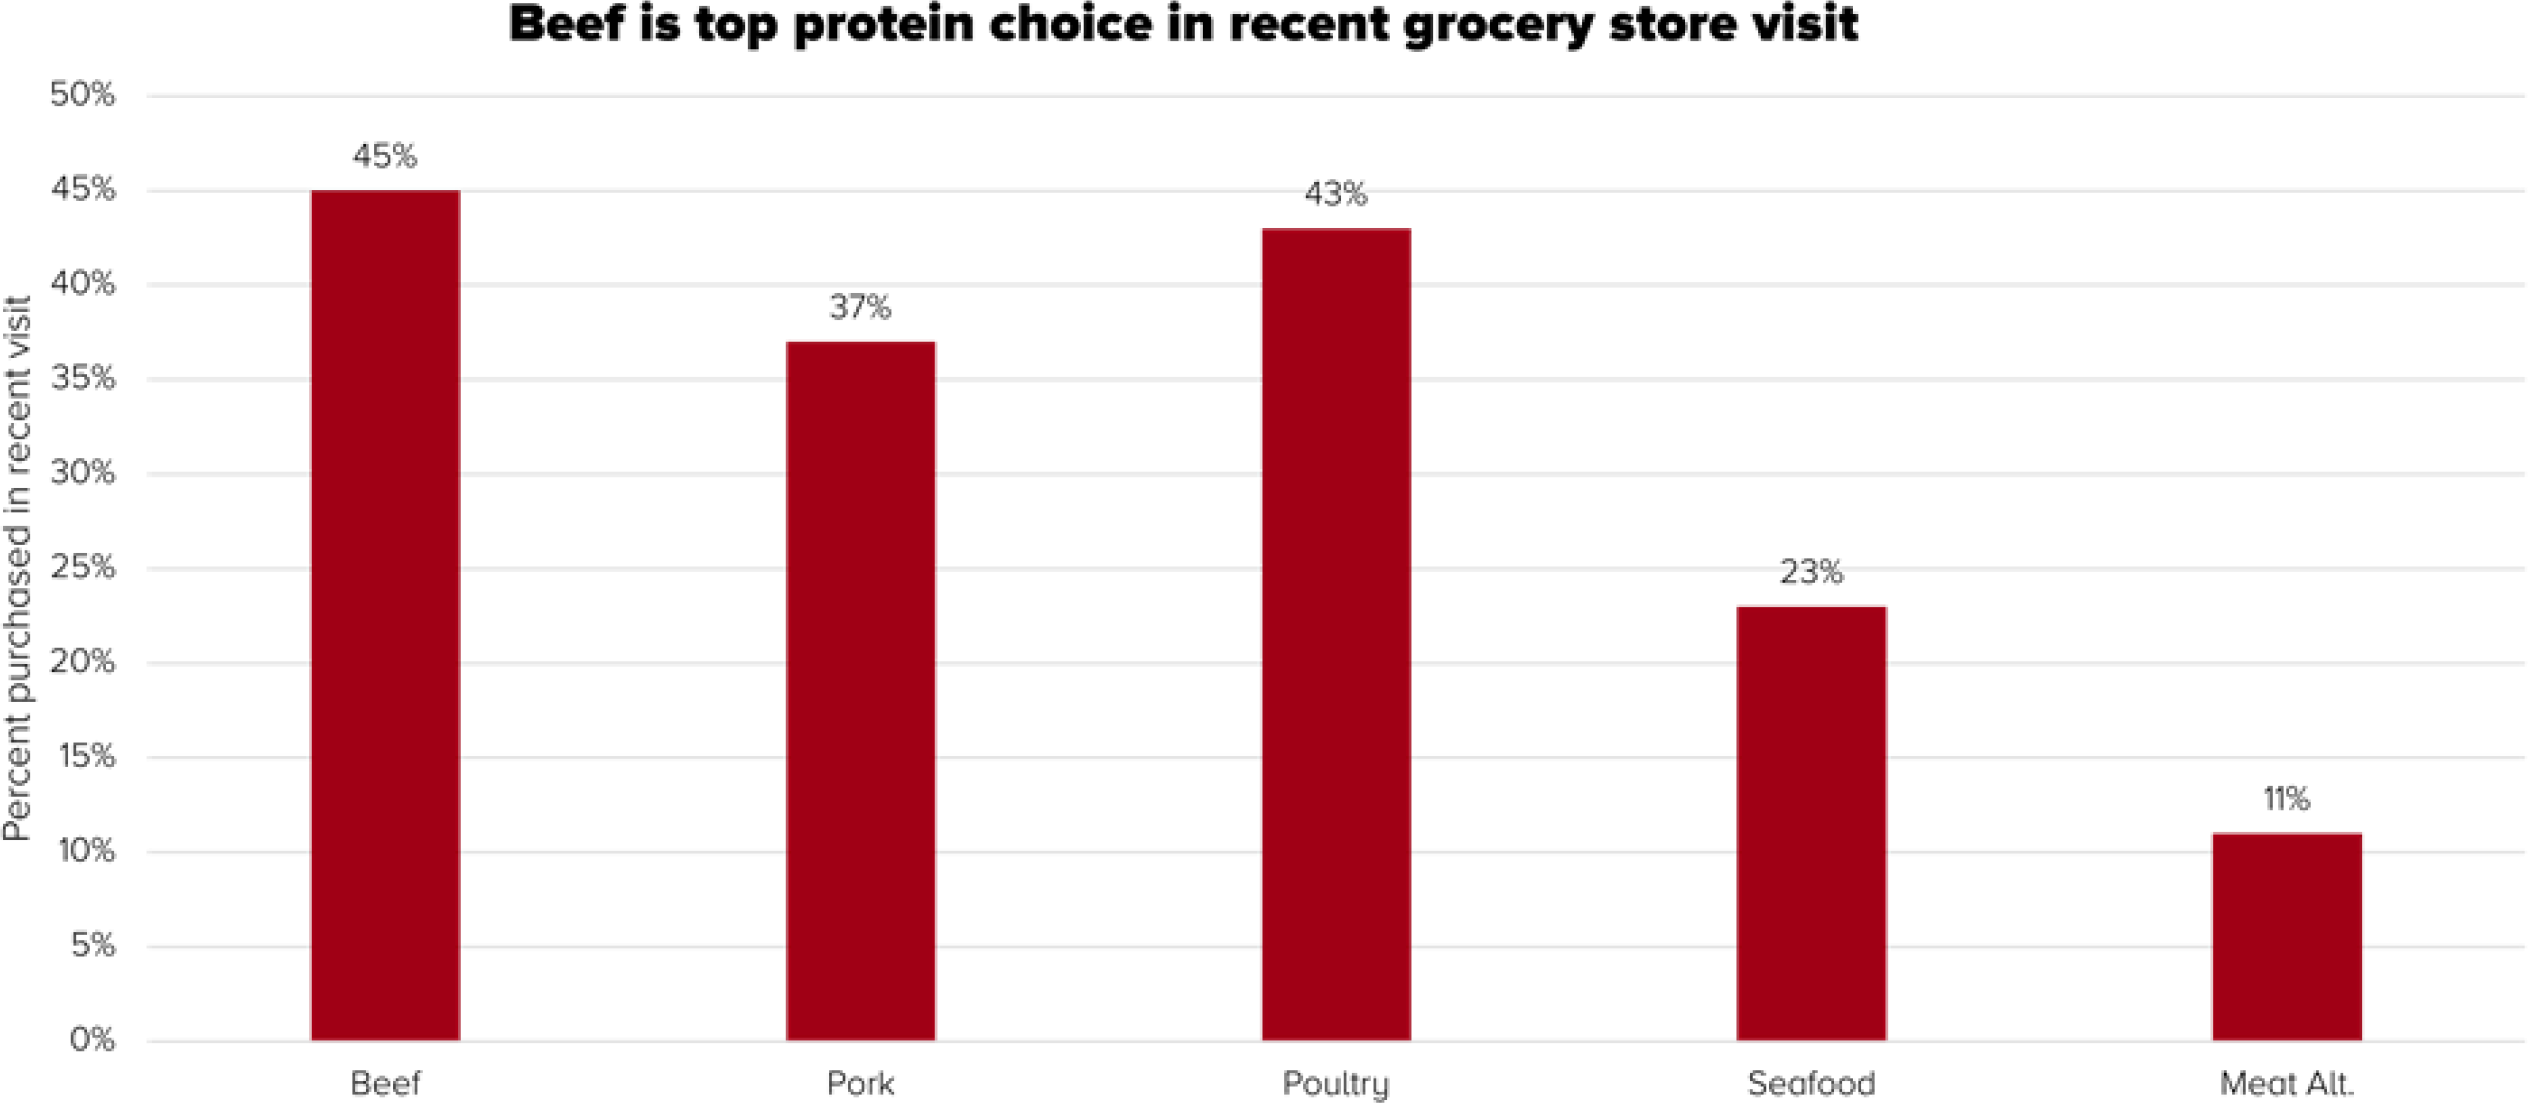
Whether consumers are heading to the store to stock pantries or pick up a meal, beef is a top protein choice. Another recent nationally representative study by NCBA, a contractor to the Beef Checkoff, found 45% of respondents purchased beef in their most recent visit to the grocery store, while 43% purchased poultry, followed by 37% purchasing pork. Fig. 3 Meat alternatives made up just over 10% of grocery store purchases.
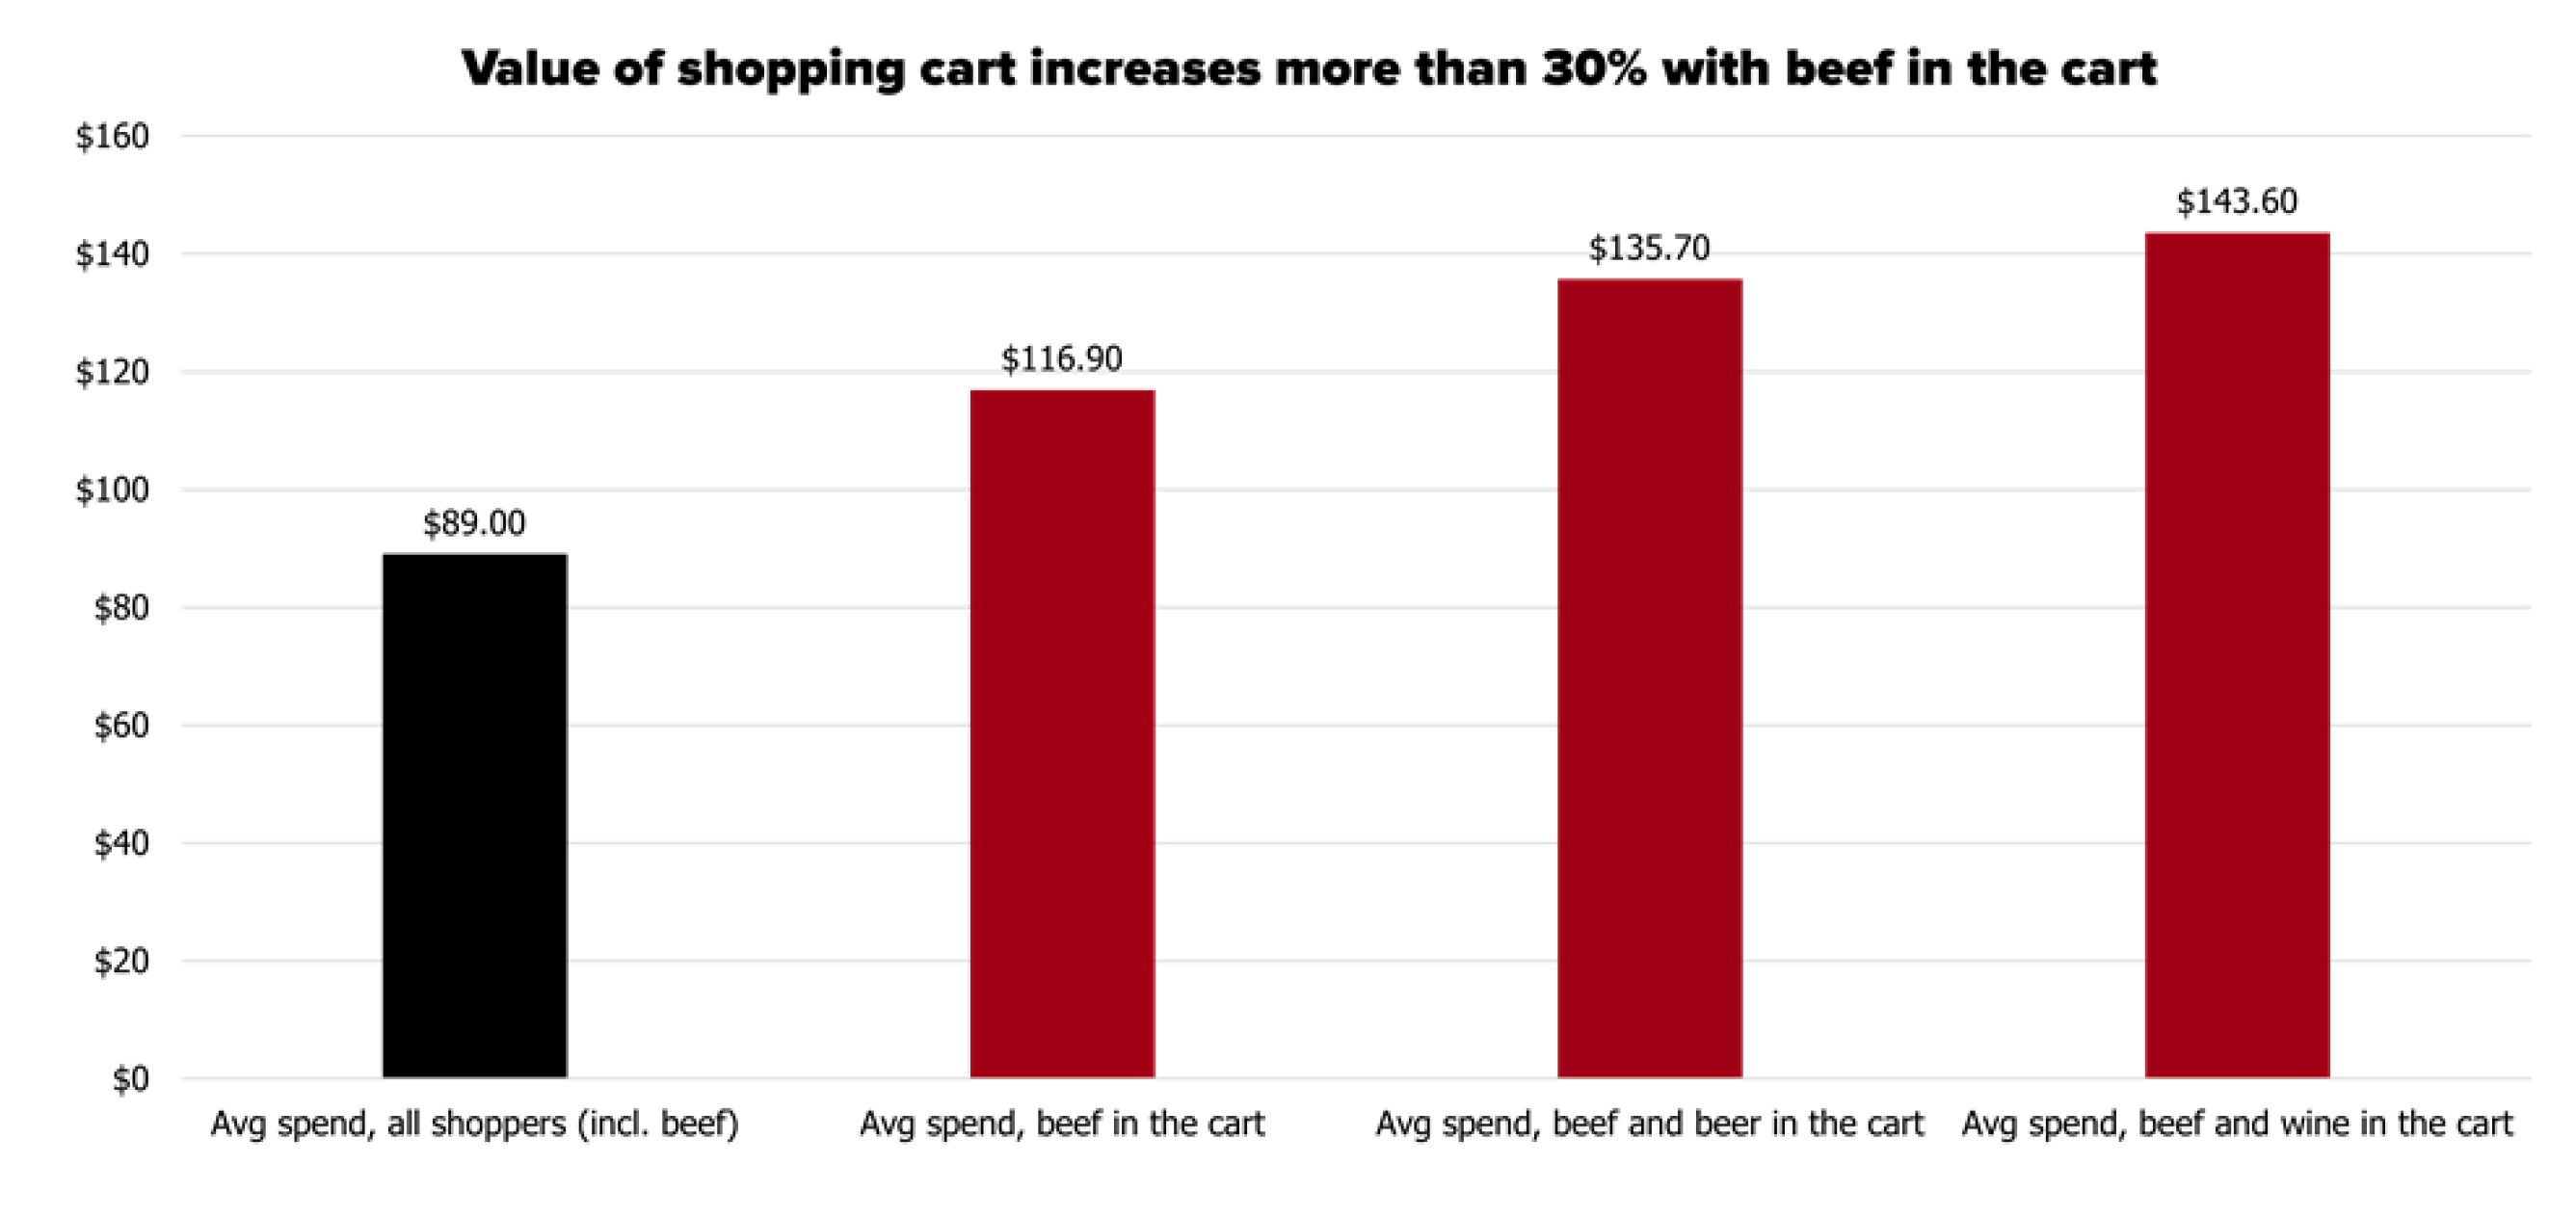
The average market basket of consumers’ recent grocery store visit is just under $90.00 when consumers add beef, the value increases more than 30% to just over $115.00. Fig. 4 When consumers include both beef and beer in the market basket, the value increases to just over $135.00 or more than a 50% increase above the average grocery spend. The inclusion of beef and wine in the shopping cart results in a market basket increase of just over $143.00, or an increase of more than 60% compared to average grocery spend of $89.00.
Grocery store shoppers are heading to the store online and in-person to stock their shelves, pick up items for the week, or find something for consumption that day. The research shows 45% of consumers purchasing beef in their recent visit, the highest noted protein purchase among beef, poultry, pork, seafood, and meat alternatives. Beef increases overall shopping basket value by more than $25.00. When adding any alcohol to the shopping cart, an incremental value can be reached of more than $45.00.4 In short, adding beef to the shopping basket has the potential to generate incremental consumer spend across all areas of the grocery store.
Fig. 1 – Primary Trip Mission Most Recent Grocery Trip: In Store/Online Trips (among all grocery shoppers).
SOURCE: Kantar ShopperScape Grocery Deep Dive, February/May/August/November 2021 and 2022 and February/May/August 2023
FIGURE 2 | Considerations When Dining at Home.
SOURCE: Consumer Beef Tracker January – June 2023. Q9/9a: “How much do you consider each of the following when you are deciding to have a meal at home/at a restaurant with beef, chicken, pork, fish, meat alternatives, or some other source of protein?”, “Top 2 Box” – Always Consider, Often Consider. Survey designed and analyzed by NCBA, a Beef Checkoff Contractor.
FIGURE 3 | Proteins Purchased, Recent Visit to Grocery Store
SOURCE: Market basket study, Survey, October, 2023. PureSpectrum – *Now we’d like to understand the items you purchased. Thinking only about your most recent visit to the store for food and related items, please tell us which of the following you purchased. Select all that apply. Survey designed and analyzed by NCBA
FIGURE 4 | Impact of Adding Beef to the Shopping Cart
SOURCE: Market basket study, Survey, October, 2023. PureSpectrum Now, thinking specifically about your meat, poultry, and/or seafood purchases, please provide the amount spent on each using the dollar amounts listed below Now, thinking specifically about your alcoholic beverage purchases, please provide the amount spent on each using the dollar amounts listed below. Survey designed and analyzed by NCBA
Sources:
- Kantar ShopperScape Grocery Deep Dive, February/May/August/November 2021 and 2022 and February/May/August 2023
- Consumer Beef Tracker January – June 2023. Q9/9a: “How much do you consider each of the following when you are deciding to have a meal at home/at a restaurant with beef, chicken, pork, fish, meat alternatives, or some other source of protein?”, “Top 2 Box” – Always Consider, Often Consider. Survey designed and analyzed by National Cattlemen’s Beef Association, a contractor to The Beef Checkoff.
- Market basket study, Survey, October, 2023. PureSpectrum – *Now we’d like to understand the items you purchased. Thinking only about your most recent visit to the store for food and related items, please tell us which of the following you purchased. Select all that apply. Survey designed and analyzed by National Cattlemen’s Beef Association, a contractor to The Beef Checkoff.
- Source: Market basket study, Survey, October, 2023. PureSpectrum Now, thinking specifically about your meat, poultry, and/or seafood purchases, please provide the amount spent on each using the dollar amounts listed below Now, thinking specifically about your alcoholic beverage purchases, please provide the amount spent on each using the dollar amounts listed below. Survey designed and analyzed by National Cattlemen’s Beef Association, a contractor to The Beef Checkoff.


