Like much of the greater economy, agricultural sectors have been subject to volatility and uncertainty over the past several years. The COVID pandemic, adverse weather, and war in Ukraine contributed significantly to disrupted supply chains and shifts in production which negatively influenced macroeconomic trends and pushed prices upward. The impacts of these events and the lingering repercussions are felt globally, with some communities, economies, and industries disproportionately affected. While agricultural production is strongly defined by location, agricultural trade is influenced at a global scale, finding producers especially subject to the adverse impacts of the past few years. In particular, the current cattle industry environment reflects the resulting volatility.
Recently released USDA reports provide insights about the current structure of national, regional, and state-level cattle herds and how current conditions compare to historic trends. Overall, when comparing national 2023 January 1 inventories to 2022 January 1 inventories, cattle inventories are down (with beef cattle inventories seeing a larger decrease than all cattle), beef replacement heifer inventories are down, and cattle on feed inventories are down. The inventory trends in the 11 continental western states (’11 states’) and for Nevada specifically report similar trends. Regarding slaughter, comparing national preliminary totals for 2022 to 2021, commercial slaughter numbers were up and average pounds per head of commercial cattle were down. Overall, total U.S. national beef production for 2022 is expected to be about 1% higher than 2021. Strong export demand and tight supplies are both contributing to strong cattle and beef prices compared to recent history. However, production input prices, especially for feed and energy, have also experienced upward pressure, squeezing net income for U.S. cattle producers.
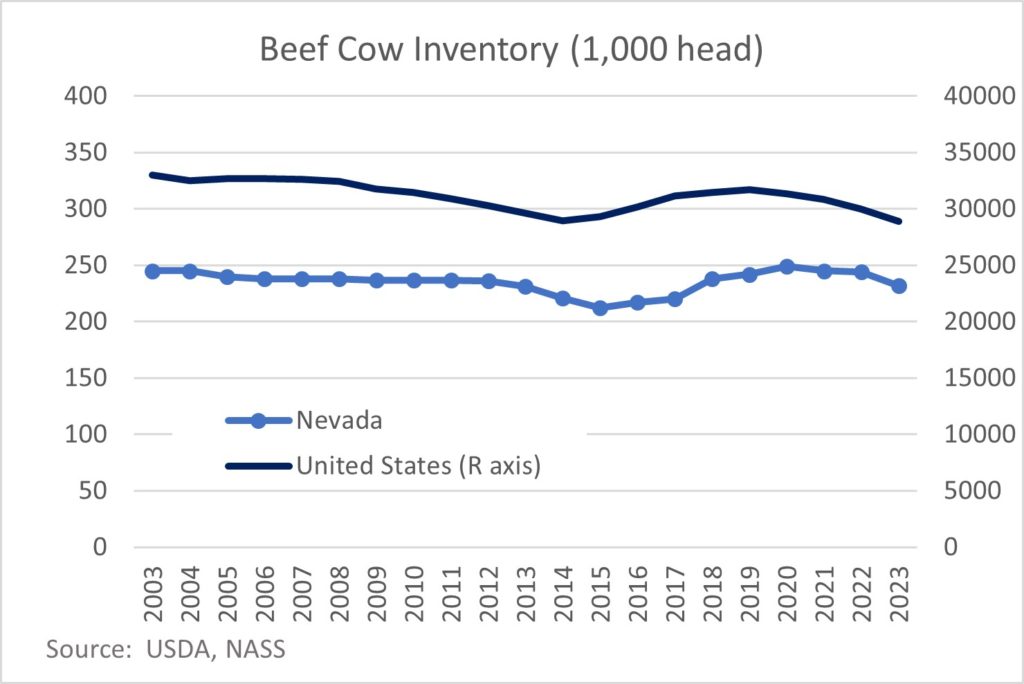
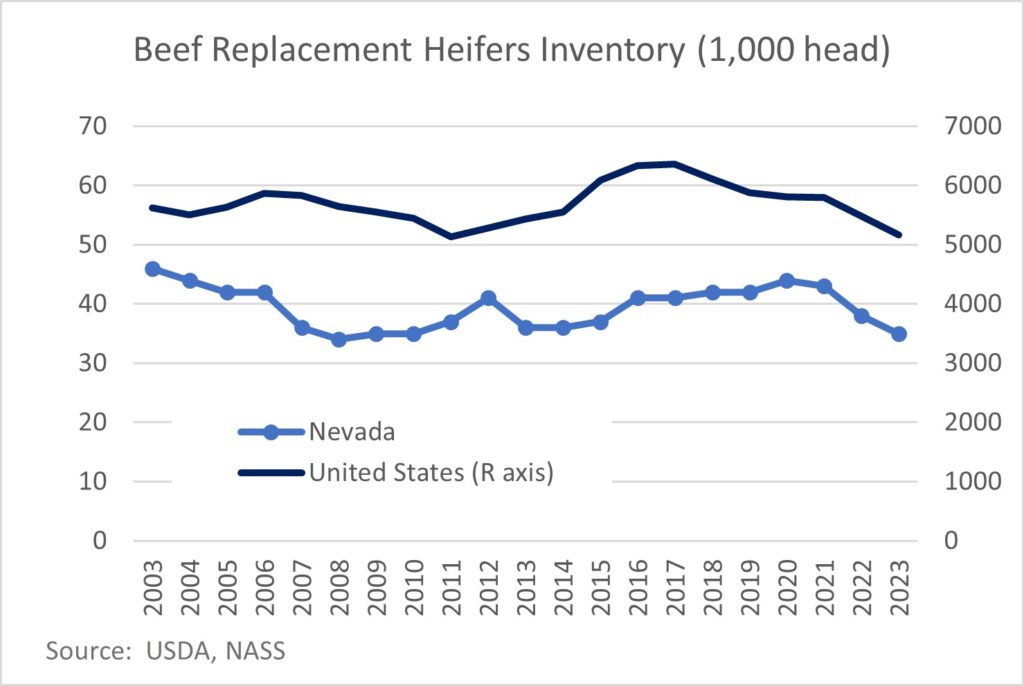
Beef cows represent the largest category of all cattle inventories in the U.S., 11 states, and Nevada. Ten year (2014-2023) January 1 averages are reported as 33%, 51%, and 30% respectively. Across those same ten years, beef cow inventories peaked in 2019, 2018, and 2020 respectively. In the case of Nevada, 2020 was the largest beef cow inventory since 2001. Yet both beef cow and beef replacement heifer inventories have been in decline. In the case of the U.S., the decline began in 2018 with 2023 beef cow inventories down 3.5% from 2022, and replacement heifers down 5.8% in 2023 compared to 2022. The 11 western states experienced similar trends but the year-over-year (YOY) decline in 2023 is reported at 2.2% for beef cows and 2.3% for beef replacement heifers. Reporting for Nevada’s beef cow inventories showed more moderate declines until 2023, which reflects a 4.9% YOY decline in beef cows and 7.9% in replacement heifers.
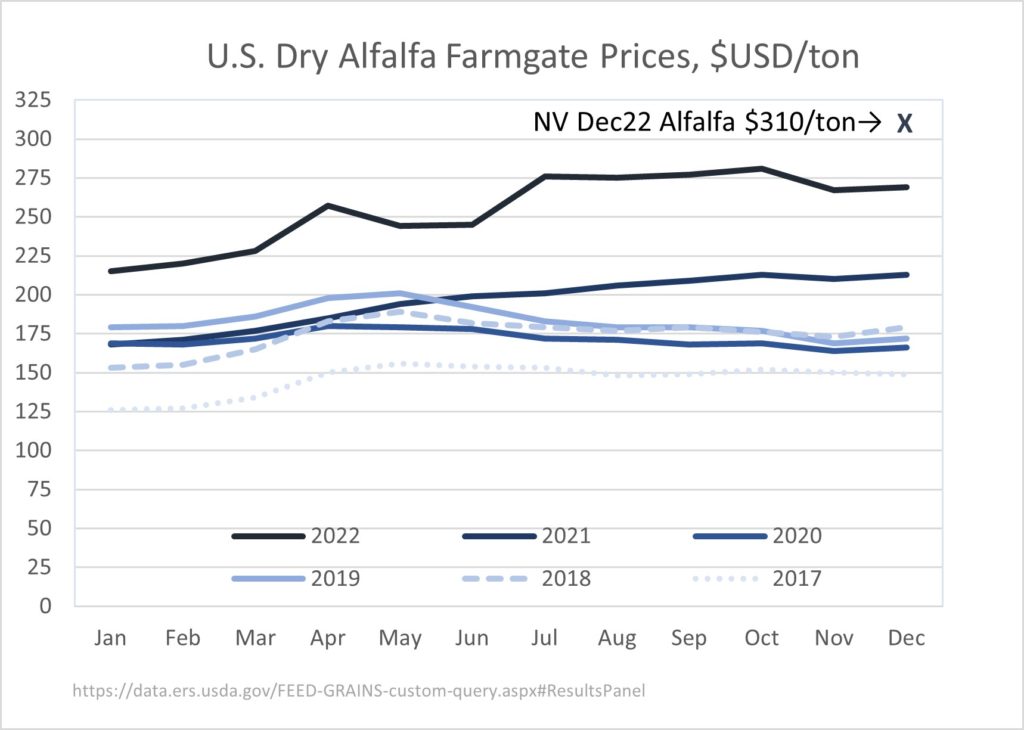
Given the production structure of western beef cattle production, particularly the dependence on grazing, the beef cow inventories seem to reflect the challenges of consecutive years of drought. In addition, the meat processing supply chain backlog following the onset of COVID-19 in March 2020 (and the preceding Tyson processing plant fire in August 2019) created even greater issues for cattle ranchers competing for limited slaughter and storage space, while continuing to hold and feed livestock. The sharp increase in demand for feed in 2020 occurred near the middle of a five year national trend of increasing cattle on feed inventories, influenced by the cattle cycle. The 2020 COVID induced feed demand shock combined with drought stressed supplies of forage and feed supported upward pressure on feed costs. The Economic Research Service’s (ERS) most recently released cost and returns data for cattle and calf producers reports data through 2021 for the U.S. and by region (Nevada is represented in the Basin and Range region). For Basin and Range producers, total feed costs average (2017-2021) 75.8% of all operating costs compared to 72.4% nationally, up 9% and 4.7% respectively over the previous five years (2012-2016). Costs associated with grazed feed averaged about 1/3 of total feed costs 2017-2021 both nationally and for the Basin Range – up 16.7% and 20% respectively over the previous five year average. Moreover, the continued rise in alfalfa prices that began in summer 2021 is not yet fully reflected in the ERS cost and returns. Monthly per ton U.S. prices for dry alfalfa averaged $254.50 in 2022, 43% higher than the average annual prices 2017-2021. Comparatively, the most recently reported price for Nevada dry alfalfa is $310/ton in December 2022, about 15% higher than the U.S. 2022 December price of $269/ton.
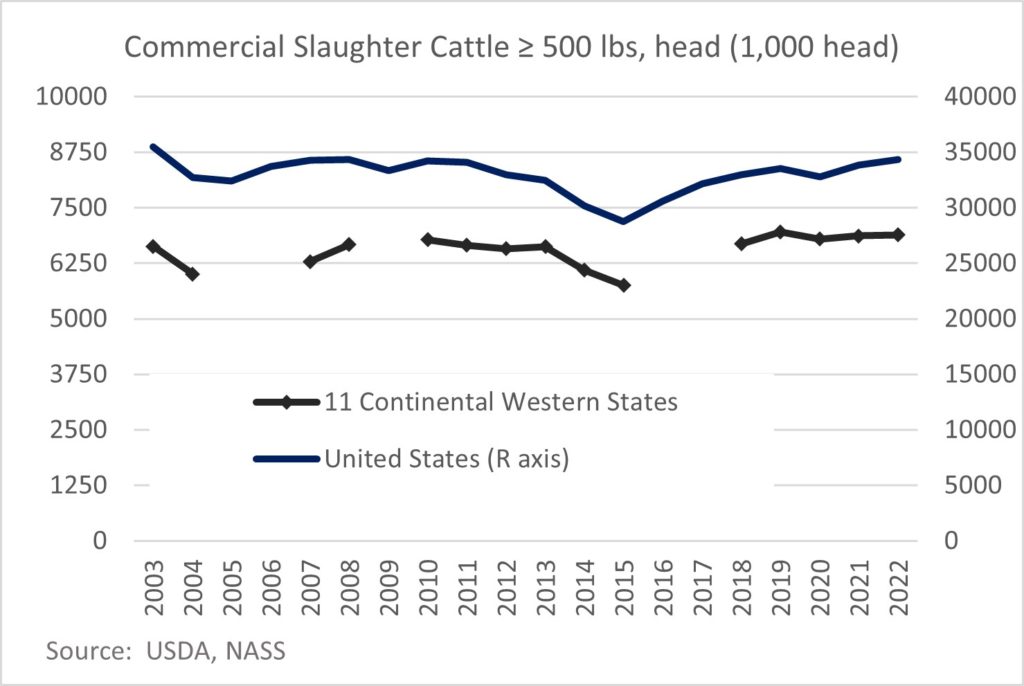
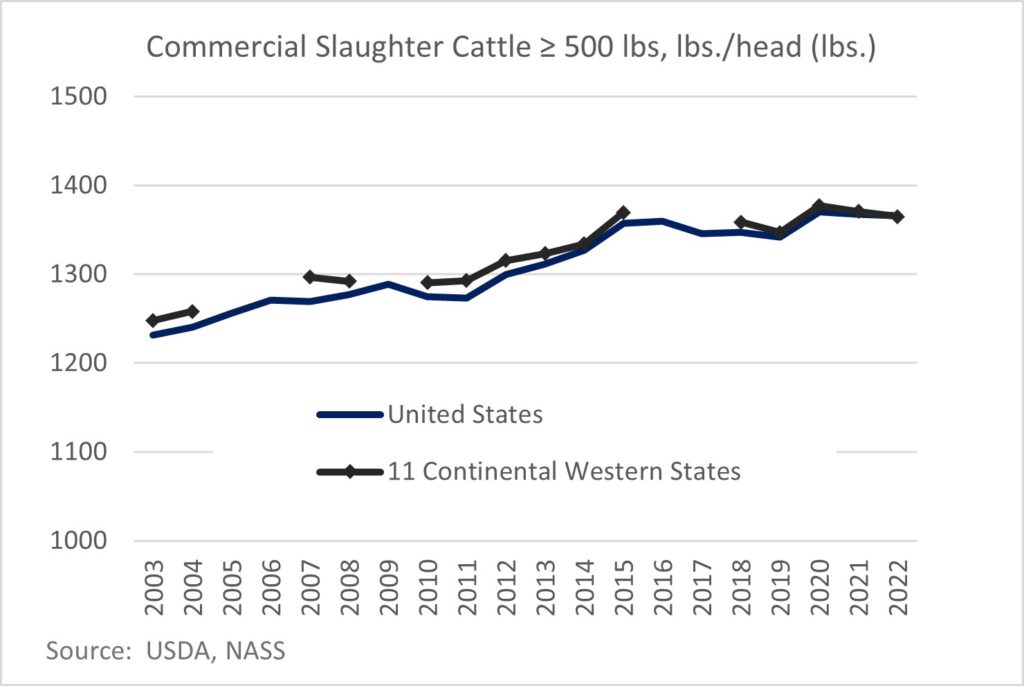
The increase in feed costs throughout the beef supply chain combined with a period of general upward price pressure, the natural cattle cycle, and adverse weather are reflected in cattle processing sector as well. Cattle on feed inventories for 2023 are reported down 3.7% nationally and 2.5% for the 11 states. Preliminary 2022 USDA commercial slaughter data for cattle at least 500 pounds reflects about a 1.4% increase YOY both nationally and for the 11 states. The same data set reflects declining live weight per head, down 0.2% YOY nationally in both 2021 and 2022. Declines for the 11 states were slightly greater at approximately 0.5% in 2021 and 1% in 2022. Overall, U.S. beef production is estimated up about 1% YOY in 2022 at 28.3 billion pounds.
On the supply side, increased production costs and moderating production contribute to higher prices throughout the supply chain, including prices received by cattle producers. The Cattle Range provides weekly 750 pound feeder steer prices by state, region, and overall average. Referencing the most report released for the week ending 2/17/23, overall price per hundred weight (cwt) ended at $182.56, up 3.9% month over month, 12.6% YOY, and 23.1% over the five year average. Nevada prices reported for the same week average approximately 98.6% overall prices across the reported times (and are equivalent to western region prices). However, Nevada’s 2/17/23 $180.33/cwt reflects a 4% month over month, 14% YOY, and 22.7% over the five year average. While U.S. demand for beef products has declined slightly in recent years with rising consumer prices, export demand for U.S. beef has been strong, reaching 3.5 billion pounds in 2022, a 3% YOY increase in volume. Value of U.S. beef exports realized a record increase of approximately a $11 billion dolloars, a YOY increase just over 10%. Asian trading partners accounted for about 70% of export beef volume.
While uncertainty continues into 2023 given U.S. economic conditions (e.g. inflation, interest rates), geo-political volatility (e.g. the war in Ukraine, China emerging from strict COVID measures), natural disasters and weather patterns (e.g. global weather events, implications from earthquakes in Turkey and Syria) to name a few, some current conditions provide benefit to cattle producers in Nevada and broader stakeholder groups. Significant precipitation in the western U.S. beginning in December 2022 decreased areas experiencing any level of drought in the 11 states by 13% (as of 2/14/23 reporting 79.6% of the 11 state area is at some level of drought). The precipitation didn’t completely remove drought from Nevada (2/14/23 reporting at 100% of state in some level of drought, but the 2/14/23 reports no location in the state is categorized as the highest classification of drought (D4/exceptional) and the areas in Nevada reported as D3/extreme in the 12/13/22 report decreased by approximately 75% by 2/14/23. Another positive trend is that while prices of inputs (namely energy and feed costs) important to cattle production remain high compared to five year averages, they are down from recent hisoric or near-historic peaks. Lastly, recently released USDA projections to 2032 expect that while U.S. per capita beef disapperance will decline slightly in the nearby years on lower production, they are expected to remain nearly steady through 2032. Howver, export demand for beef is expected to grow approximately 14% by 2032.
Sources:
The Cattle Range. Feeder Steer Prices for the week ending February 17th https://www.cattlerange.com/pages/market-reports/weekly-feeder-cattle-prices-by-state/, accessed 2/20/23
U.S. Department of Agriculture, Economic Research Service. Commodity Costs and Returns data,https://www.ers.usda.gov/data-products/commodity-costs-and-returns/, accessed 2/20/23
U.S. Department of Agriculture, Economic Research Service. Livestock, Dairy, and Poultry Outlook: February 2023 https://www.ers.usda.gov/webdocs/outlooks/105840/ldp-m-344.pdf?v=6037.6, accessed 2/20/23
U.S. Department of Agriculture, National Agricultural Statistics Service. Cattle 1/31/2023 https://usda.library.cornell.edu/concern/publications/h702q636h?locale=en, accessed 2/20/23
U.S. Department of Agriculture, National Agricultural Statistics Service. Nevada Hay Prices December 2022 https://www.nass.usda.gov/Statistics by State/Nevada/Publications/Crop Releases/Nevada Hay Prices/, accessed 2/20/23
U.S. Department of Agriculture, National Agricultural Statistics Service. Quick Stats, https://quickstats.nass.usda.gov/, accessed 2/20/23
U.S. Department of Agriculture, Office of the Chief Economist, World Agricultural Outlook Board. USDA Agricultural Projections to 2032 https://www.usda.gov/sites/default/files/documents/USDA-Agricultural-Projections-to-2032.pdf, accessed 2/20/23
U.S. Drought Monitor. Compare Two Weeks, https://droughtmonitor.unl.edu/Maps/CompareTwoWeeks.aspx, accessed 2/21/23
This economic report was written exclusively for the Progressive Rancher by Malieka T. Bordigioni

